KPI Dashboard WordPress Plugin
Scorecard follows every initiative through five stages of the customer journey, from the first time somebody hears your name to the day they recommend you. Put the KPIs that matter inside those stages, give each one a monthly goal, and fill them in by hand on one screen — or connect the software you already run and let it fill them in for you.
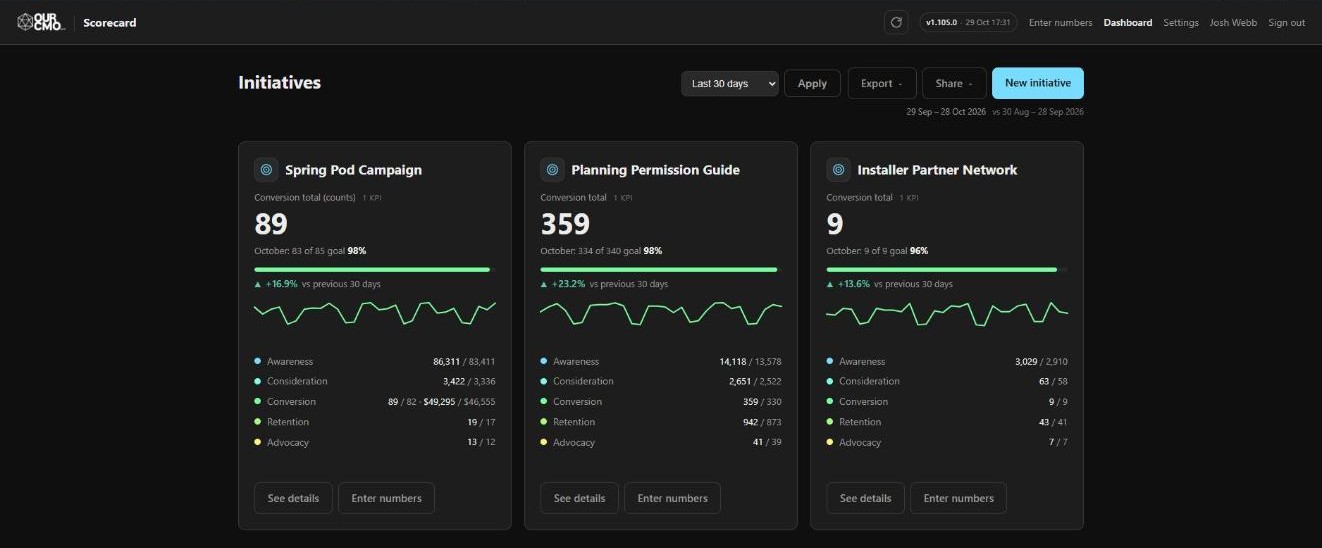
The struggle
Your numbers already exist. They just live in nine different places.
Sessions in Analytics. Impressions in Search Console. Giving in the CRM. Form entries in the website database. Engagement inside Facebook. A spreadsheet somebody keeps by hand. Nobody adds them up, so nobody answers the only question that matters: did this month work?

Why KPIs
What gets measured gets done.
It is the oldest rule in management and it still decides which months work. A number somebody looks at every month gets attention. A number nobody has pulled since March gets excuses. Everything in Scorecard is built to make the looking cost nothing, because looking is the part people actually stop doing.
A number nobody owns is a number nobody moves
Pick the handful that decide whether the month worked, put a goal on each one, and the work arranges itself around them. That is the whole trick — and it only holds while the numbers are in front of people.
So nobody adds them up
Which means nobody answers the only question that matters: did this month work? And by the time somebody has assembled the answer, the month is three weeks gone and nothing can be done about it.
How it works
Three decisions, and then it runs.
Make an initiative
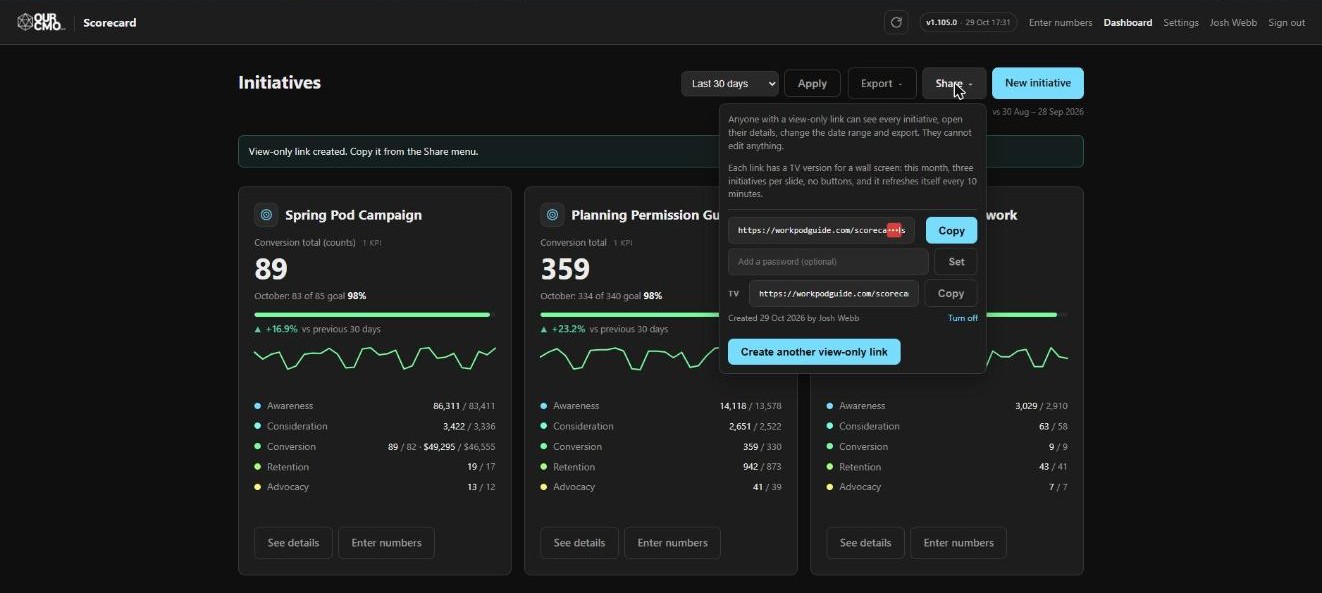
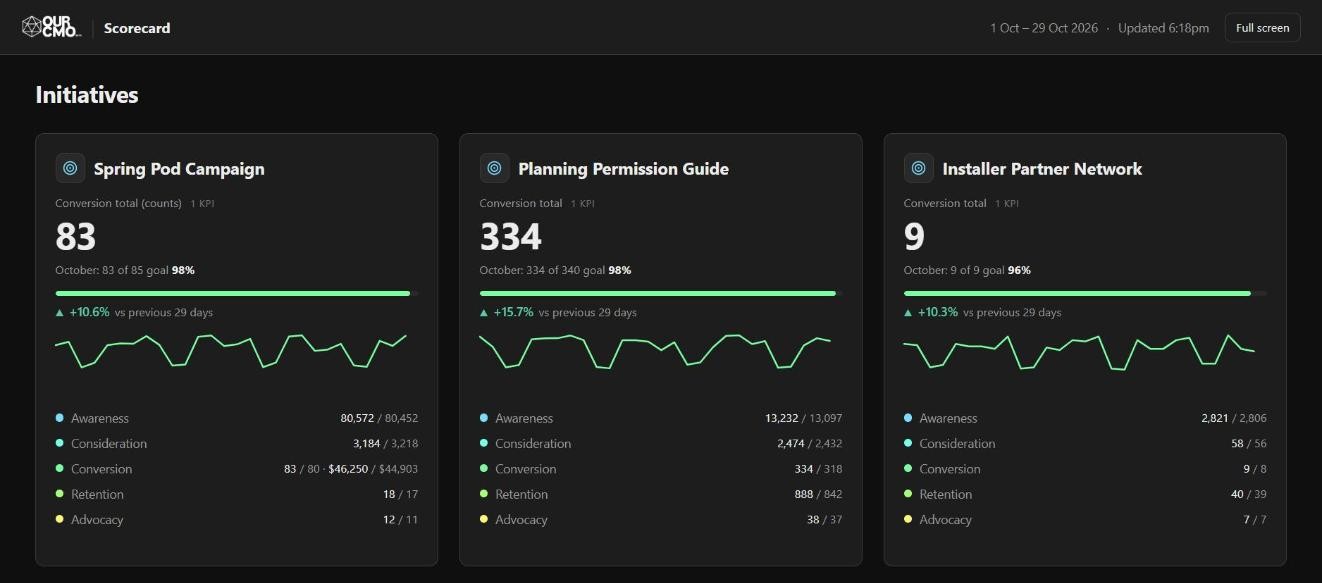
A campaign, a programme, a product line, a location. It arrives with all five journey stages ready, and gets its own card, its own chart and its own share link. Run as many at once as you like.
Make KPIs inside each stage
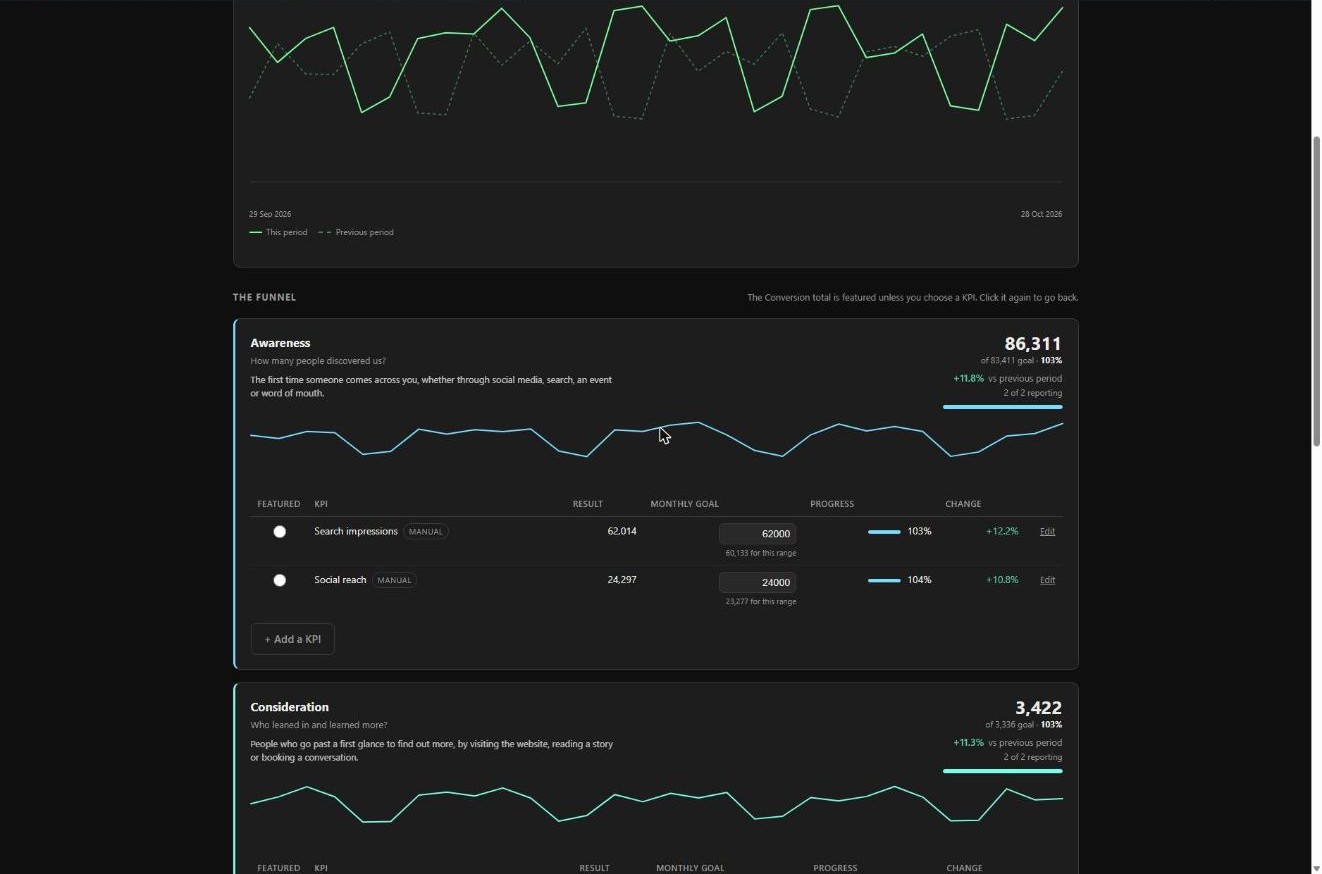
Put every number into the stage of the customer journey it belongs to, and give it a monthly goal. The stage adds its KPIs up and compares that total with the sum of their goals, so a stage is either met or missed rather than merely reported.
Assign how each KPI is tracked
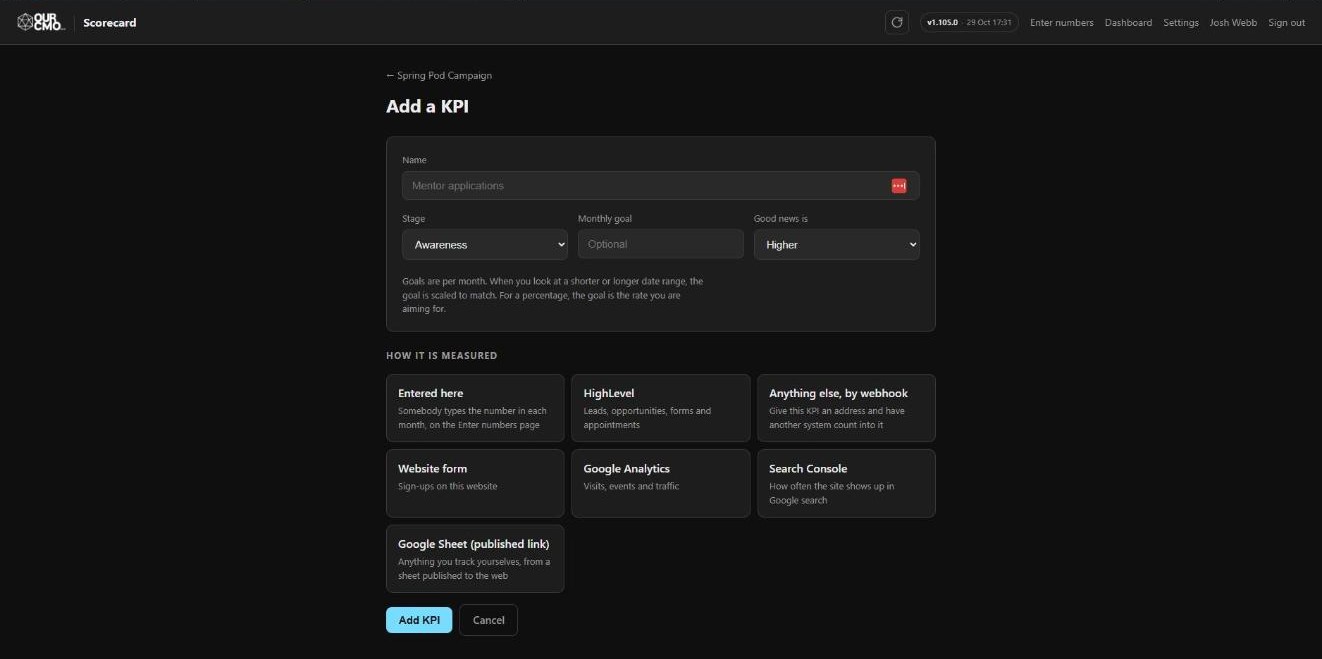
Say where the number comes from: typed in by hand, or read from an account you have connected. Change your mind later and the history you have already collected stays exactly where it is.
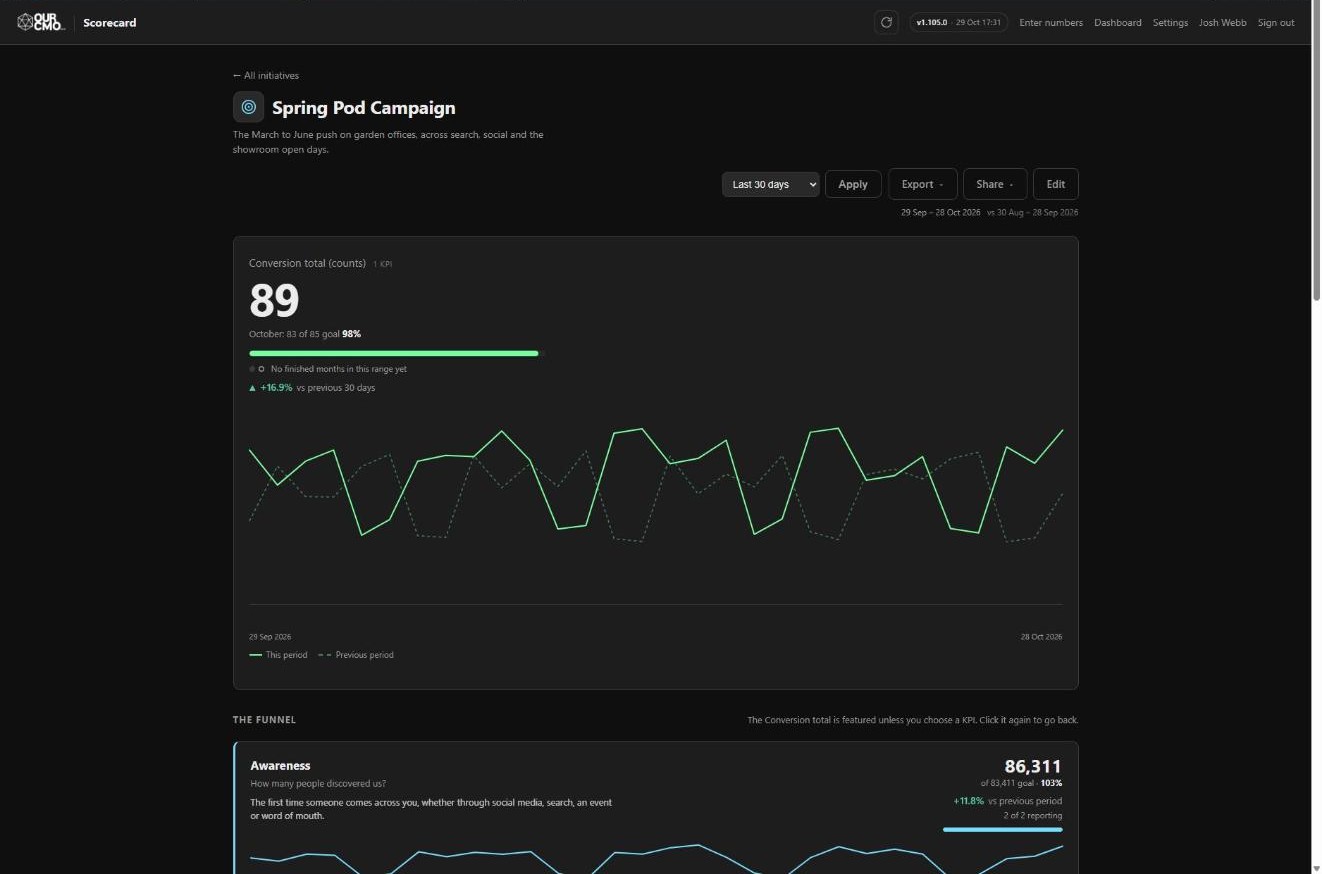
The point of the five stages is that you see the whole journey at once. A conversion figure on its own tells you nothing about why it moved. With awareness, consideration, retention and advocacy sitting beside it, you can see where the drop actually is — and every stage keeps its own question, its own trend line and its own total against goal, so you are reading a funnel rather than a single number.
Awareness
Who has heard of you at all. Search impressions, reach, first visits.
Consideration
Who is paying attention. Engaged sessions, time on page, repeat visits.
Conversion
Who acted. Forms, applications, gifts, bookings. The headline figure.
Retention
Who came back. Repeat giving, renewals, returning customers.
Advocacy
Who brings you someone else. Referrals, reviews, shares.
The same five on every initiative, and they are fixed in the plugin's code rather than its database, so no import, no admin screen and no well-meaning edit can reorder or delete one — rename them into your own language, and you still cannot lose one. The colours are not decoration either: Scorecard turns your brand colour's hue back in fixed steps to build them, so the funnel matches your site without anyone picking swatches.
Totals that mean something
Dollars are totalled with dollars and counts with counts, side by side. Percentages are never summed at all — a retention rate shows its latest value and stays out of the total. Adding a dollar goal to a count of applications produces a number nobody can use.
Comparisons that are fair
Every range is compared against the previous period of the same length, so a part-month is never measured against a whole one. A rolling range ends yesterday, because today is still incomplete and most sources report it hours late.
How to track
Type it in by the month, or connect what you already run.
Both fill the same stages, the same goals and the same charts, and a KPI can move from one to the other without losing its history. Most scorecards end up a mixture: a few things nobody can automate, and everything else arriving on its own.
Track each KPI by hand, month by month
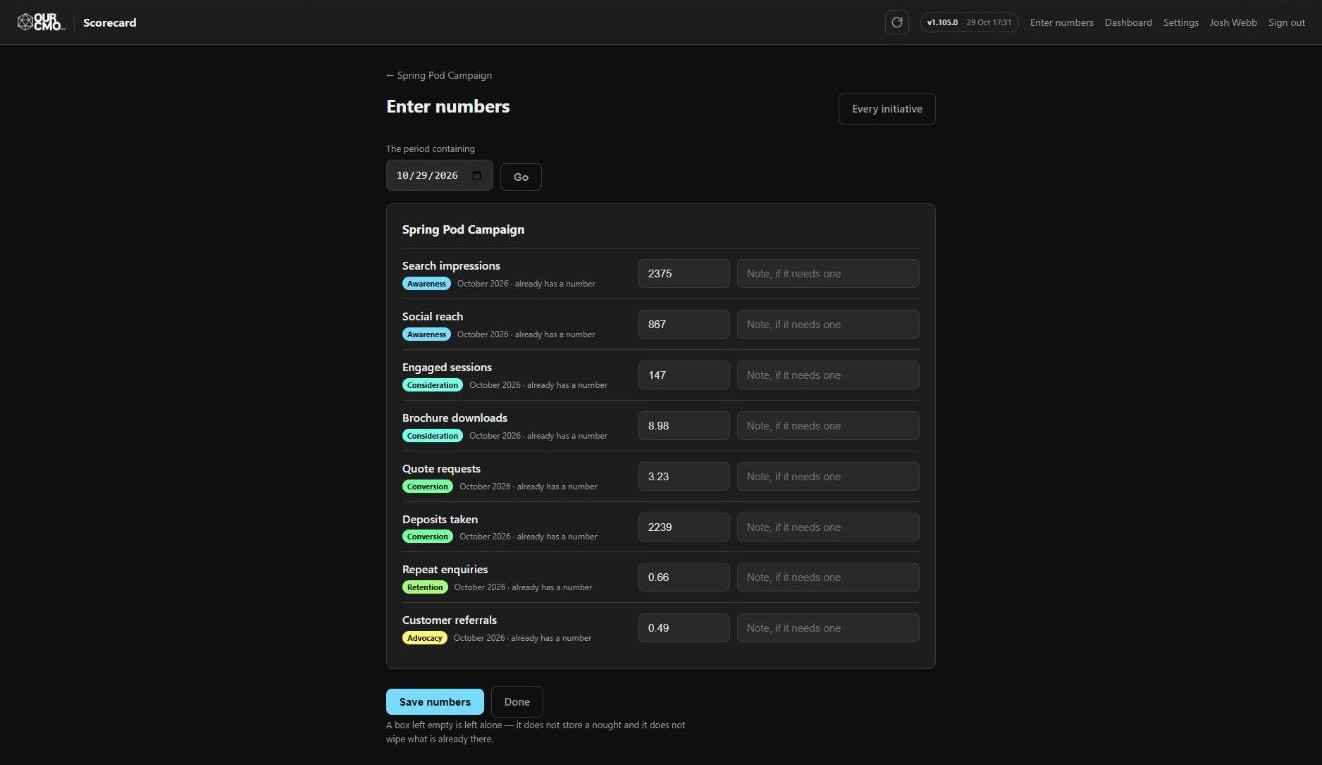
One screen lists every KPI you keep yourself, grouped by initiative, each with the month it belongs to. Type this month's figure, or step back to an earlier month and correct it.
Paste straight out of a spreadsheet — commas and dollar signs are understood. Leave a box empty and nothing changes; it is not read as a nought. Get one wrong and the whole form stops, so you never have to guess which half of it saved.
Connect the software you already use
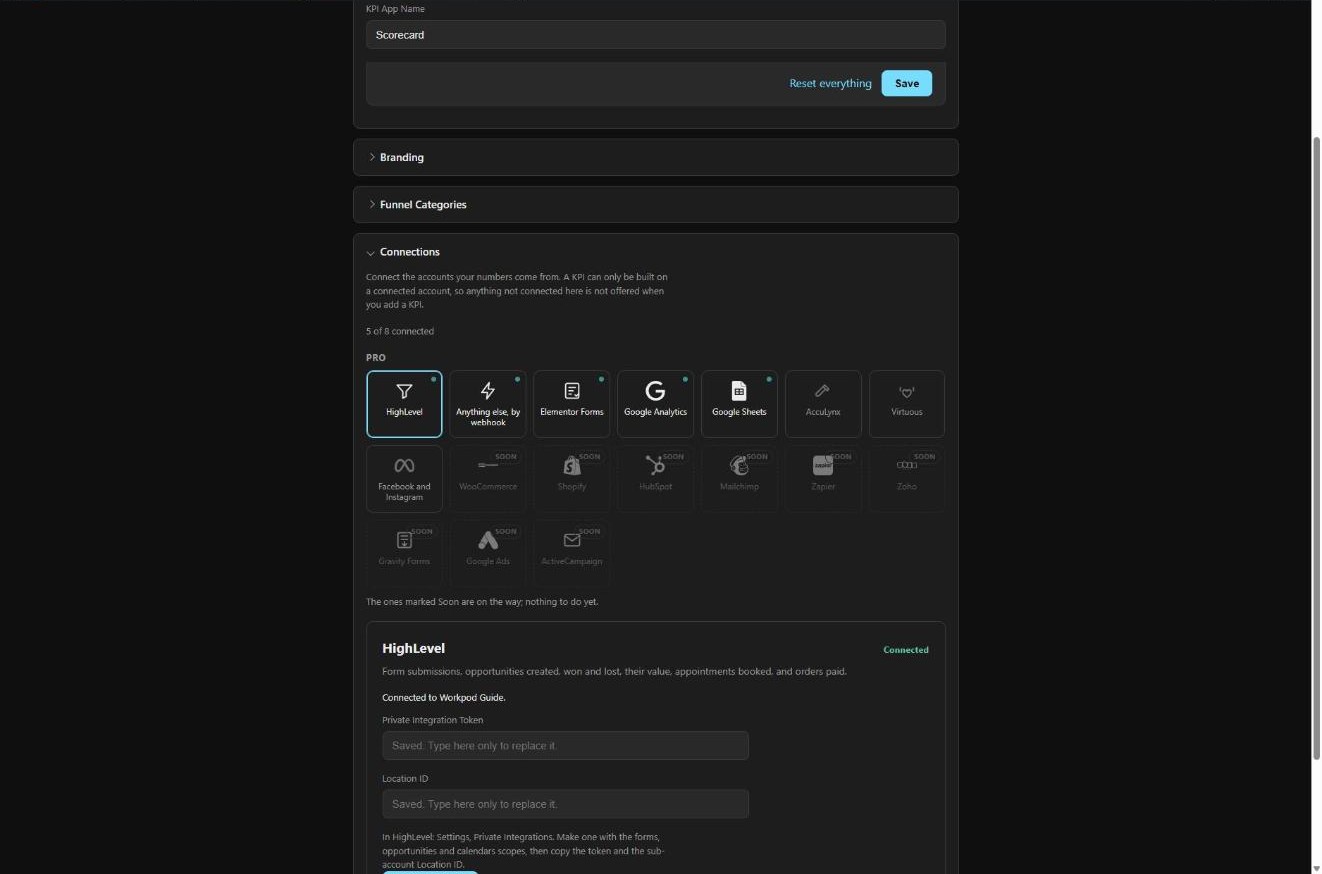
Sign in to Google or Facebook and pick the property, the Page or the sheet from a list of what that account can actually read. No developer console, no API key to copy.
Scorecard then collects one reading a day on its own, and backfills your history the first time it connects. A number that comes up blank says why, underneath itself, instead of showing you nothing.
Connections
Nine it reads today. Nine more on the way.
Connect an account once and Scorecard stores one reading per day per KPI, so charts trend over real days instead of jumping once a month. What each connection is genuinely good at is worth more than its logo:
Google Analytics
ProVisits, events and traffic
Search Console
ProHow often the site shows up in Google search
Google Sheets
ProPrivate, or a published link
Meta
ProFacebook and Instagram
Website forms
ProSign-ups on this website
Virtuous
ProGiving from the donor CRM
HighLevel
ProLeads, opportunities, forms and appointments
AccuLynx
ProJobs as they move through the milestones
Anything else, by webhook
ProGive this KPI its own address
Coming
Named in the plugin, so you can see where this is going.
These show on the Connections screen marked Soon, with nothing to do yet. Anything on the list that can send a web request when something happens can already be counted today, through the webhook above — Zapier included.
White label
The same app, wearing somebody else’s brand.
Three real installs below, photographed on the same afternoon. Nobody wrote any CSS. Each one is a name, a logo, dark or light, and one main colour — the five stage colours are built from that colour by turning its hue in fixed steps, so the funnel matches the brand without anyone choosing five swatches.
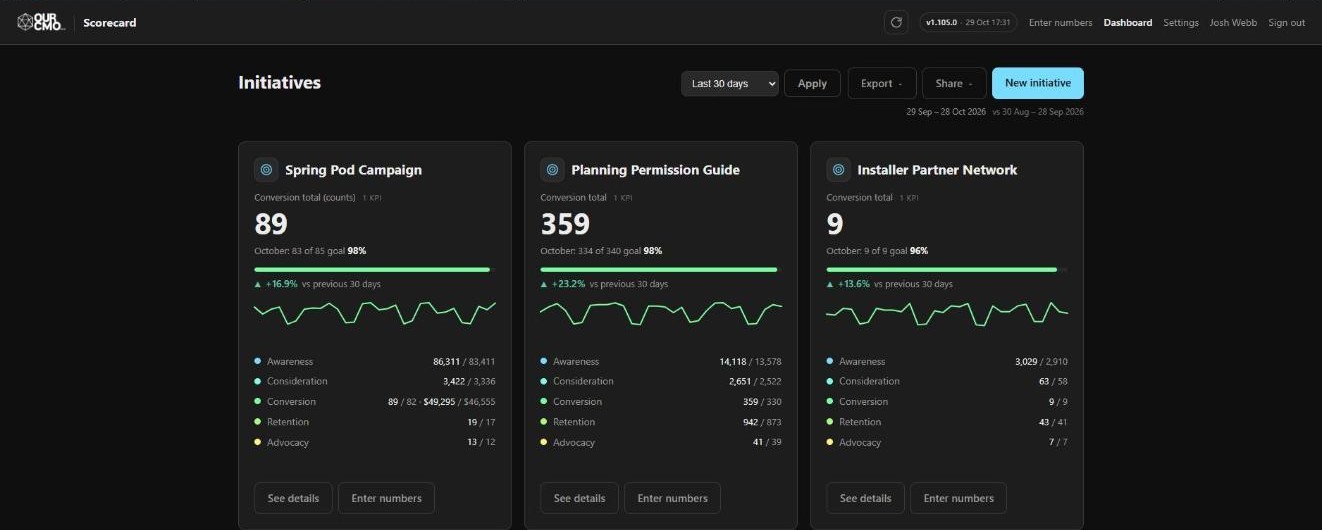
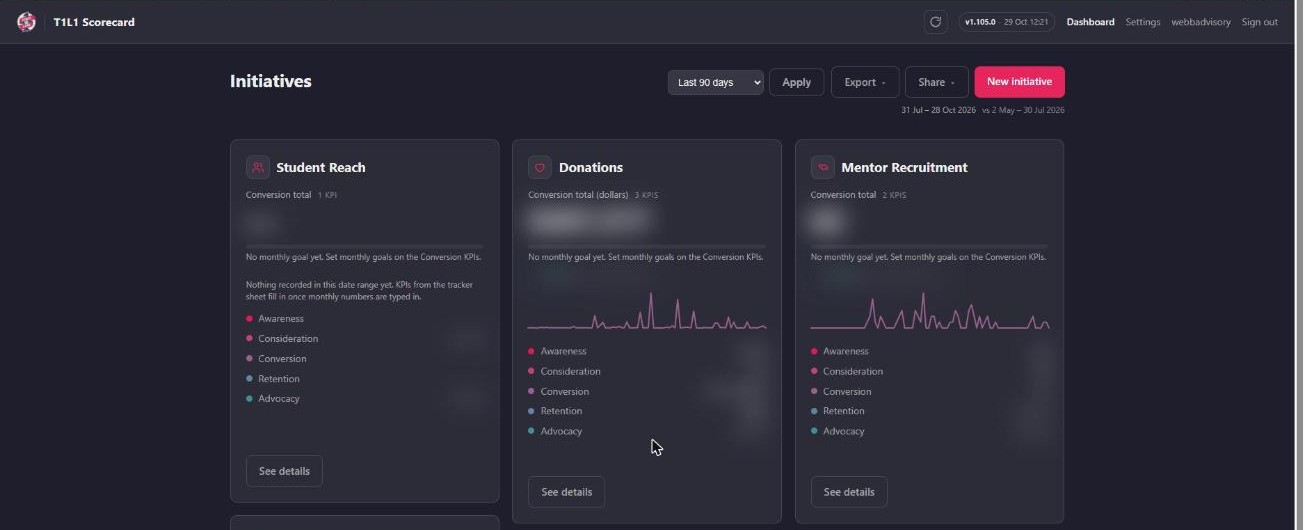
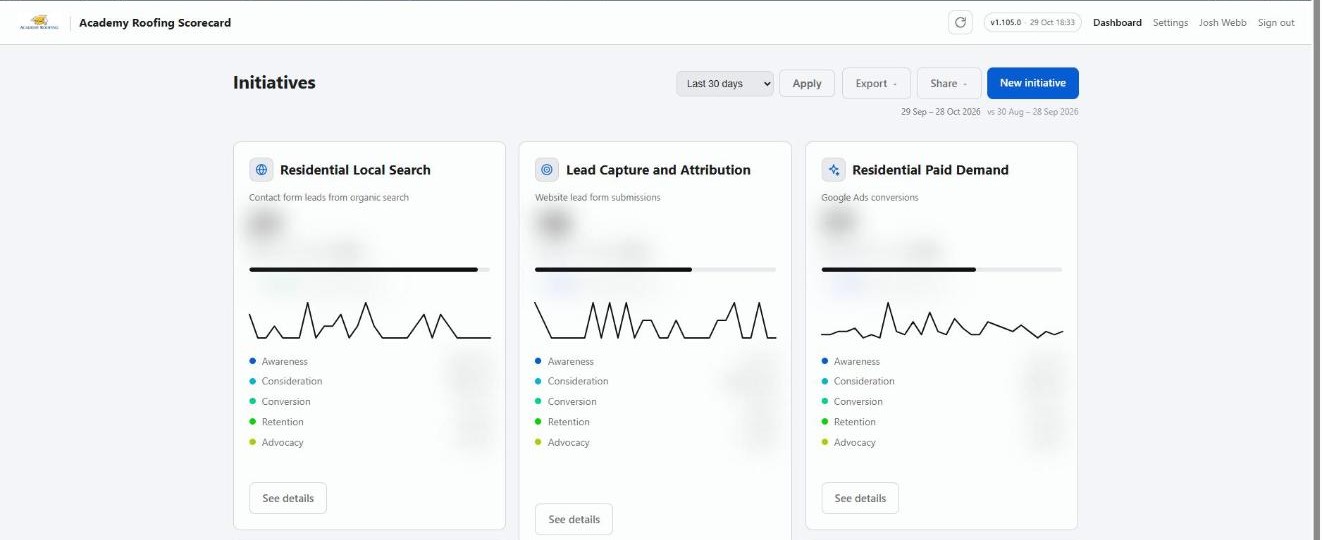
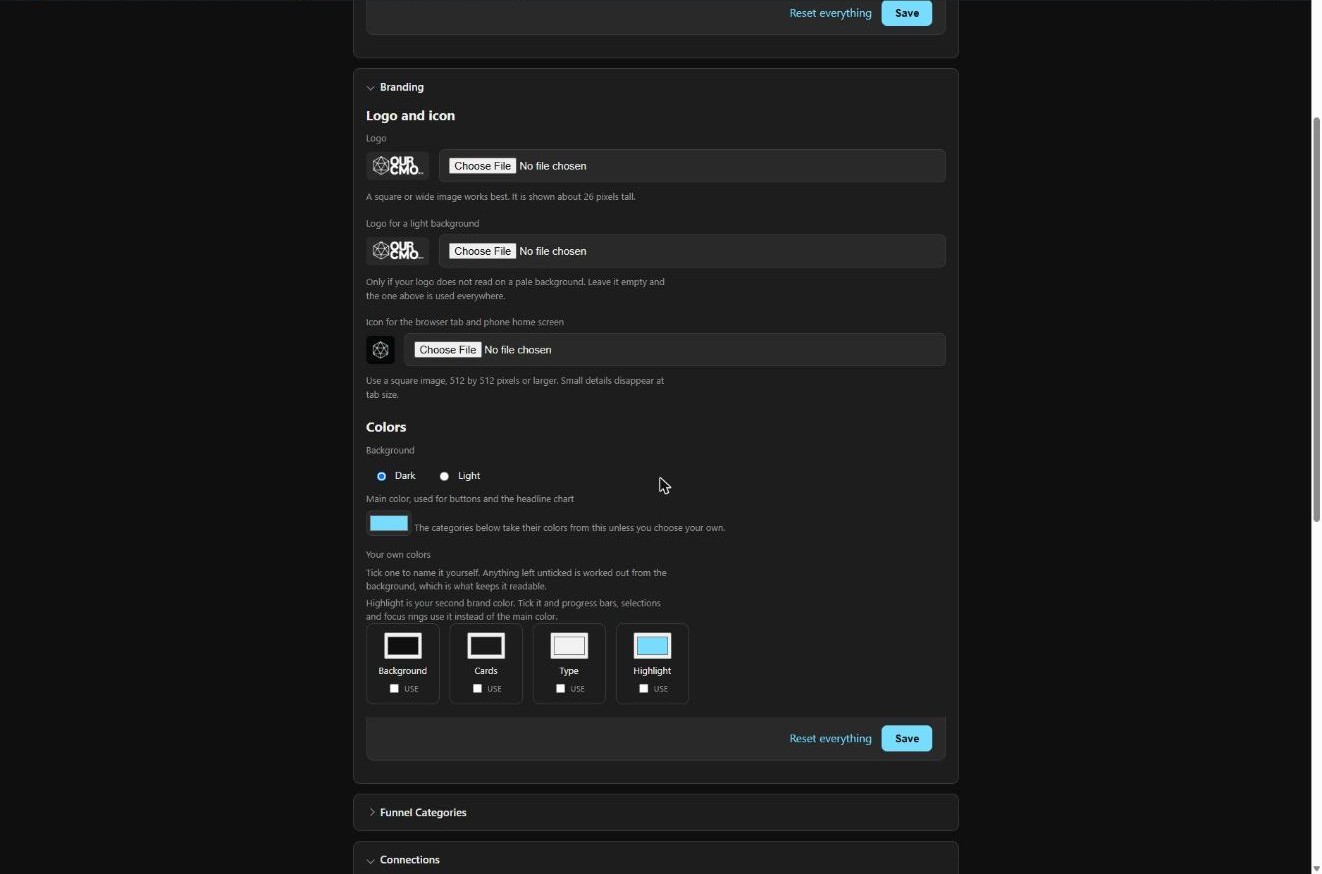
Figures are blurred in the two client installs: those are real numbers belonging to the businesses that own them. The branding is the point here, not the results.
Pricing
Free is what you type in. Pro is every connection.
Free
The whole app, filled in by hand
Forever, on as many sites as you like.
- Unlimited initiatives, all five stages
- Unlimited numbers and monthly goals
- Charts, date ranges and period comparisons
- View-only share links, passwords and TV mode
- PDF, image and CSV export
- Your app name, your wording, light or dark
Pro
Everything above, filling itself in
One licence, one site.
- All nine connections, syncing daily
- Sign in to Google and Facebook — no app setup
- Your logo, tab icon and full brand palette
- Backfills history the first time it connects
- Tells you which number failed, and why
- A lapsed licence makes the app smaller, never broken
FAQ
Questions, answered straight.
Where does the data live?
On your own WordPress install, in your own database. Scorecard reads from the services you connect and writes the readings locally. Nothing about your figures is stored anywhere else.
What happens if I stop paying for Pro?
You keep every number already collected, and every initiative, goal and share link. The connections stop fetching new readings and the paid appearance controls lock, holding whatever you last set. The app gets smaller; it does not break.
The connection I need is not on the list.
Give that KPI its own webhook address. Anything able to send a web request when something happens can count into it today, Zapier included — which also covers most of what is still marked Soon.
Do I need all nine?
No. Anything you have not connected is greyed out and folded away, so a nonprofit is not looking at a roofing CRM. Connect one, connect nine.
Can I rename the five stages?
Yes — the label, the question underneath and the sentence below that are all yours, free. What you cannot do is reorder them, delete one or add a sixth. That is deliberate: the shape of the journey is the one thing every initiative has in common.
Does it slow my site down?
No. Syncing runs on a schedule in the background, inside a strict time budget, and picks up where it left off if it runs long. Visitors never wait on it.
Stop guessing whether the month worked.
Install it, add one initiative, set one goal. At the end of the month the answer is sitting on a page you can send to anyone — and it was assembled while you were not looking.